
The Digital Shop® Blog
You spend your days diagnosing vehicles, but did you know you should also be applying that diagnostic mindset to your shop? That was the topic of conversation in a recent episode of The Digital Shop® Talk Radio where the expert panel of experts, Bill Connor, Tom Dorsey, and Uwe Kleinschmidt, took a deep dive into the business control panel (BCP).

What KPIs should I use?
.png?width=150&name=Roy%26Bill%20(1).png) “If you’re working on a vehicle in your shop that had a performance problem, you’d use some data to go in and understand what’s going on,” Bill said. “If you want to get some extra output out of that vehicle, you’re going to look at certain data points on a vehicle. But in our case, we’re going to be looking at KPIs (key performance indicators) on the business control panel (BCP) to diagnose your shop.”
“If you’re working on a vehicle in your shop that had a performance problem, you’d use some data to go in and understand what’s going on,” Bill said. “If you want to get some extra output out of that vehicle, you’re going to look at certain data points on a vehicle. But in our case, we’re going to be looking at KPIs (key performance indicators) on the business control panel (BCP) to diagnose your shop.”
With that diagnostic mindset in place, you can assess how your shop is doing and where you need to improve using the BCP. In short, Bill believes that your shop performance can be broken down into key input KPIs and output KPIs. Essentially, it’s all about driving revenue (output) and ARO (output) by looking at a handful of inputs. When you improve the inputs, the outputs should also increase.
Here are the KPIs that Bill believes you should look at when evaluating your shop:
INPUT
- Inspection rate
- Edited pictures per inspection
- Average number of pictures taken per appointment
- Inspections sent
- Inspection sent rate by appointment
- Average research time by motorists per inspection
- Average billed hours per RO
- % Jobs completed on tablet
- Technician efficiency
- Technician proficiency
- SA efficiency
- Exit scheduling rate
OUTPUT
- Average weekly revenue
- ARO
If you’re new to using the BCP or getting back on track, there are a couple of things that Bill thinks you should focus on when looking at your KPIs.
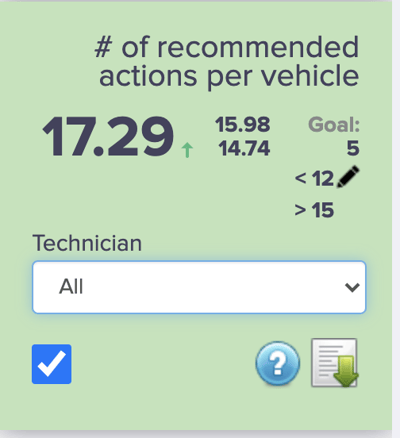
- Spotting needs by using the number of recommended actions per vehicle - “First of all, are they doing inspections, but more importantly, are they spotting needs?” Bill stressed. Mainly, are your automotive techs recommending between 7 and 15 things that need to be addressed between this visit and the next visit? If you are using a well-built inspection sheet, it should be pretty easy to find those recommendations which will drive revenue and ARO.
- Edited pictures per inspection - Is your tech taking photos that make it easy for your service writer to edit them and send them to customers? Is the tech providing notes or arrows on the picture? Is the service advisor sending them to customers? According to Bill, these are a few things to consider and will ultimately stack the odds in the shop’s favor.

The major KPIs listed above cover a lot of the day-to-day workings of your shop, but Bill has a few lesser-known BCP metrics that he knows help shops “find opportunities for improvement.”
- SA Efficiency - Technician Portion - “Everybody complains about ‘I don’t have enough damn technicians, I can’t find them,’” Bill shared. “To me, the solution to the technician shortage is to go ahead and make the technicians that you have extremely profitable for themselves and the shop by actually dispatching, getting the right type of jobs in, and actually measuring their performance.”
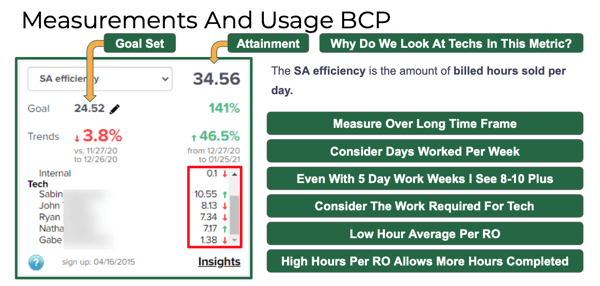
He even pointed out that some shops who complain about the tech shortage may have “more of a shortage of process than actually a shortage of skilled staff members.” One way to ensure your technicians are “fat and happy” is to dive into the specific metrics for each of your techs to make sure they are reaching their potential, Bill said. - Average billed hours per RO - Technician portion - Another favorite data point for Bill to look at is the tech portion of the RO.
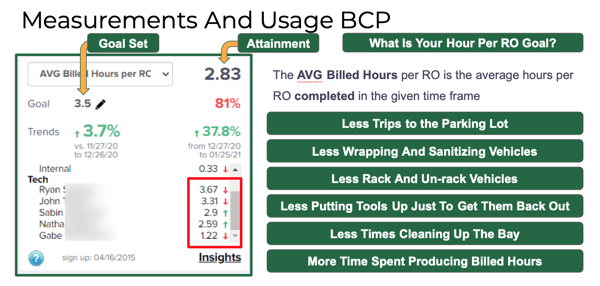
“If they’re not three hours plus, those guys are wearing out their sneakers going back and forth to the parking lot, and they’re wearing out their back bending over racking and unracking cars,” he said.
Use logic
Another tool to use when it comes to the BCP is logic, says Bill.
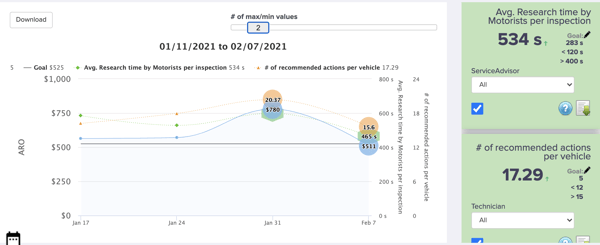
This is especially true with specific KPIs, including the average research time by motorists per inspection (MRT) and the average number of pictures.
For the MRT, Bill suggests that you use an average of one minute per recommendation to gauge how your shop is doing.
“If I’ve got 8.6 recommendations, I know that if the customer was in the shop and they walked out to the car, for the technician to take their finger, point at it, tell them what it is, what needs to be done, and the reason they should buy today, at most shops that takes an average of one minute per inspection,” Bill told Tom and Uwe. “So, if I’ve got 8.6, I multiply it by 60 seconds, and then I know if the MRT is in the proper area.”
The more inspections, the higher the MRT.
Tom added, “When it comes to KPIs, don’t just have a number in mind that sounds good. It has to be specific to your operation.”
The average number of pictures KPI is also highly logical.
“If you’ve got 15 recommendations and your average picture count is 10, you’ve missed the ball somewhere,” Bill said.

How to create constant improvement
Now that you have looked at your BCP, how do you improve upon what you’re seeing?
According to the expert panel of experts, there are five things to get the ball rolling - and keep it going!
- Start with the inspection rate - Are you inspecting every car that comes through your doors? Are you sending out every inspection that your techs have completed? These are two ways to start moving those KPIs.
- Constant praise/constant correction - Rapid continuous improvement comes with constant monitoring, says Bill. When you know a staff member is doing well, praise them, and when a staff member seems to be struggling, ask them how you can help them get these numbers back up.
- Make sure the techs know what is in it for them - Buy-in makes all of the difference. Use the KPIs to show how much they have improved and what that means specifically for them.
- Morning meetings - Bill is a firm believer in the five-minute morning meeting with each staff member.
“I really like to go in and prep for and conduct a five-minute morning meeting,” he said. “Go in highly focused on just one or two different things for each employee because every employee is going to be in a different spot in the journey as they go through the digital transformation in your shop. I do a quick meeting with them based on data, so it’s not personal, say ‘These are the results from yesterday and I know this is important to both you and I, how can I help you go and do this?’” - Keep moving the goal line - Some may call him an evil referee, but Bill is just pushing his shops to be the best they can be.
“Every time you cross the goal line, I’m going to go and move the goalposts,” Bill told listeners of The Digital Shop® Talk Radio. “A lot of people say, ‘Where is my shop number compared to another shop?’ and in my eyes, I really don’t care because what I want to do is I want you to learn how to squeeze the maximal peak level performance out of your own particular shop database, employees, customer base, and so on. I like to go in and set these goals and keep moving them forward. My goal isn’t to go ahead and see everything on the screen here in green. My goal is to go ahead and keep moving the goals upwards until we can’t go and get anything else out of your shop. And then, if you don’t add a new bay or change your pricing model, then it’s your job to hold them there after you find your peak level of performance.”
