
The Digital Shop® Blog
Babcock Auto Care deserves a mic drop.
Just ask Mike Bennett, ATI Coach, who shared a case study about the Rochester, Minnesota shop in a recent episode of The Digital Shop® Talk Radio.

The Babcock Auto Care Story
 Mike has been working with Babcock Auto Care for many years, and while they have always been a high-performing shop, in late 2019, a deep dive into some KPIs found a few areas where they could make some improvements.
Starting in October 2019, Mike began working with the managers to make changes, specifically to the digital inspection process.
“One of the things that we were really looking at at the time was trying to decide whether or not we felt that, although they were very good in using the inspection tools and inspection process, we weren’t really sure that they were getting the full impact,” Mike said.
Using both the ATI diagnostic tools and AutoVitals business control panel (BCP), Mike noticed that the estimated average - the total that they look at for potential of estimated work - while good, wasn’t as good as it could’ve been.
“Prior to sitting down, we had a shop that was doing a good job,” Mike said. “Their average vehicle was producing for them an estimated value of about $915.56... [then] the service counter did a fantastic job. They were converting almost 50% of the dollars that they were presenting for an average order value of $472.89. So in all accounts, a rather successful shop. But when we dug a little deeper, and we looked at some of the feedback we were getting from the digital inspection platform, what we realized is the inspections - we were doing it, but the problem was we weren’t doing the inspections completely.”

‘The three phases of evolution’
Once they had found the area to hone in on, it was time to move to what Mike calls “the three phases of evolution” in a digital shop.
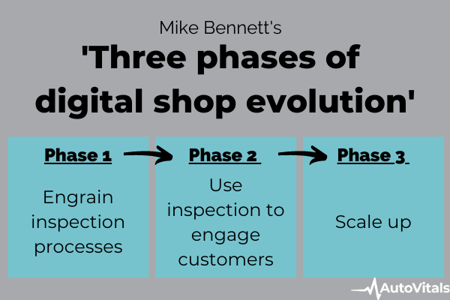
The first phase is about getting the inspection process drilled in. Ensuring the effectiveness of performing the inspections, making sure the inspection process is consistent, having the techs bought into the process, and providing results and recommendations are all essential parts of phase one.
The second phase is the time to use the inspection to help engage the customer.
“We have the inspection, and now our sales process and the inspection engages that customer, and we’re trying to create a dialogue and an understanding and a value proposition that obviously results in sales,” Mike told Tom Dorsey, host of The Digital Shop® Talk Radio, and Uwe Kleinschmidt, founder of AutoVitals.
The third and final phase is then scaling up, ultimately resulting in increased levels of revenue, increased levels of satisfaction, and all the things that go along with a better customer experience.
Babcock Phase 1: Getting the ball rolling
At Babcock Auto Care, they started concentrating on making sure the basics of phase one were in place. Mike found that when they started back in October 2019 with this, they saw about 115 vehicles per week and were inspecting between 50-55% of those cars, with an equal amount of inspections being sent.
Mike wanted to make improvements around those numbers, but to do that, he first had to have a conversation with some members of the Babcock Auto Care team.
“The conversation was based around belief systems,” Mike said. “I asked the shop, ‘Hey, listen, you’ve got 115 vehicles coming in the shop a week, why are we only inspecting 50% of those vehicles?’”
The answers from the back of the shop ranged from ‘sometimes they get pushed by service advisors,’ or ‘we just don’t have time to get it done,’ or ‘we just inspected that vehicle a few weeks ago.’ The front of the shop had slightly different answers, including ‘we really know our customers and Mr. Jones just isn’t a guy who appreciates inspections,’ or ‘we don’t want to waste time when there isn’t a practical purpose for it.’
So Mike took the time to get the opinion leaders of the shop to change the belief system and the mindset of the shop.
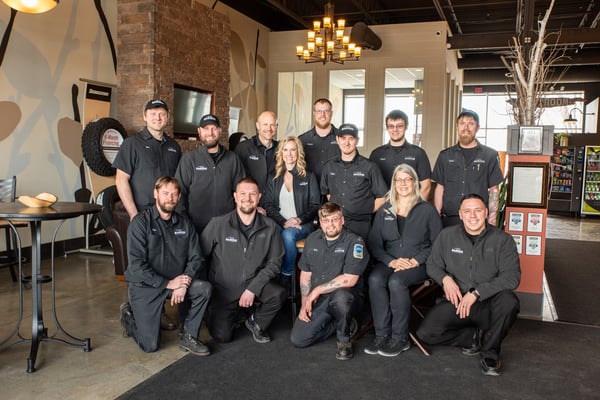 The crew at Babcock Auto Care
“If [those opinion leaders] are on board, and you can drill that down through your staff, we’ve got an opportunity to potentially really move some stats,” Mike told them.
He also talked with that same group of shop leaders about consistency and professional obligations.
“We can’t pick and choose when we want to pay attention to a car,” he told them. “We can’t assume somebody does or doesn’t want to do something.”
Ultimately, a customer can choose using the information they are given, he said, but auto shops have a professional obligation to make sure they’re consistent and providing motorists the information they need to make an informed and educated decision.
Once Mike had these conversations, he again spoke to the front counter staff and the guys in the back to make sure everyone understood the role they needed to play for this to be successful.
“I turned to the sales counter, and I said, ‘If these service technicians and the shop foreman are going to bust their butt and get all of these inspections done and make these recommendations, you guys got to step up your game as well and actually do something with them,’” Mike said. “There’s nothing more demotivating to a technician who spends their time and invests in that inspection not to have the inspection realized and put forward to the customer.”
He also talked with the shop employees about what the wins would be. Then, they set a target of inspecting 80% of the cars coming through the doors.
Mike received a little pushback from the front counter. The staff believed they knew their customers better and didn’t think that their motorists would find value in the inspection.
Mike made them a deal. He told them that if they were right and knew their customers better than he did, the ARO won’t change. But if he were right, they would see the estimated value go up and, correspondingly, the ARO, too.

Phase one results
Mike checked in with the crew at Babcock Auto Care each week. They talked through the stats and addressed any pushback, but they started to see estimate values, ARO values, and technician hours increasing quickly.
Check out Mike Bennett's summary of Babcock Auto Care here
“By the time we got to the end of the six weeks, we no longer had to talk about ‘this is what we agreed to do for six weeks,’ because it now became ingrained and they started telling me how successful it was,” Mike shared with The Digital Shop® Talk Radio panel.
Mike believes the difference was really in the change of the belief system.
The unexpected: COVID-19
Then, the world came to a screeching halt.
“Remember, we’re working on this in October 2019, pre-COVID,” Mike said. “We’re on a good path. We’re seeing these numbers come up immediately. We saw the $875 -$900 estimate values going up to $1,000 - $1,300. We’re seeing the average repair order start to come up a little bit. They’re believing it, and the momentum is getting stronger and stronger, but then COVID hit.”
The automotive industry was hit, and it was hit hard.
Sales of new vehicles were down more than 15% in 2020 - one of the industry’s worst annual declines since 1980, and Lang Marketing found that annual mileage on U.S. roads plunged more than 12% in 2020. It marks only the seventh year since WWII that mileage has fallen, but the severity of the drop was six times larger than any previous annual driving decline.
Babcock Auto Care wasn’t immune, especially since Rochester, MN, home to the Mayo Clinic, is a very white-collar medical market. Many of the people who worked in the area were able to stay home, and people just stopped driving. Additionally, those who usually come from out of town to visit Mayo weren’t coming.
They started to see a drop-off in their car count, losing nearly 25 cars a week.
“To any other shop in any other situation, that’s debilitating to colossal,” Mike said. “It ends up killing you. But, I’m very pleased to say that when we look at it from a total sales point of view, you’ll notice we dropped nearly 25 vehicles per week and maintained within $600 weekly revenue average.”
It all goes back to those six weeks where they worked on implementing phase one.
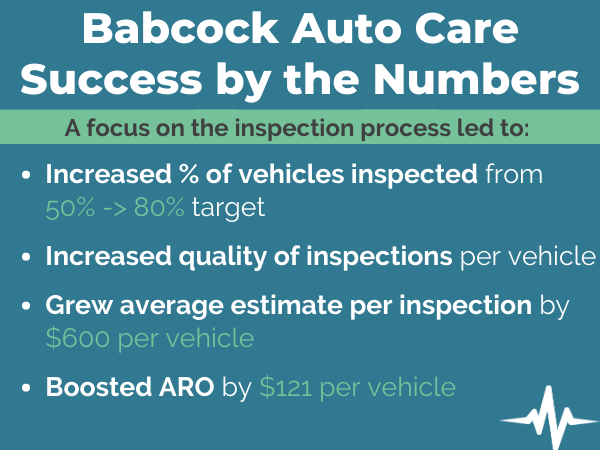
“We’ve increased the average estimate at this shop from $915 per vehicle to over $1,518 per vehicle,” Mike shared. “We’ve added just over $600 per average vehicle - same customers, same demographic, same mileage - we’re just more effective and more consistent with a larger number.”
Here’s where the mic drop comes in.
Remember when Mike told the front counter, ‘if I know the customers better, by showing them more, they’ll buy more?’
Well, by the numbers, Mike was right. Revenue increased by $121 per vehicle over the last 67 weeks.
“If I had a mic, I’d drop it,” he said. “This is an unbelievable success by the shop, and it’s not me. It’s them embracing the system and really being able to modify the belief systems.”
But it isn’t just the revenue that has increased. It is everything that matters when it comes to customer engagement, including trust and value.

Find part two of this amazing story here.